
Is the Washington, D.C. housing market facing a sudden collapse ignited by DOGE’s job-cutting? A whirlwind of social media posts from dubious figures has sparked speculation that a large influx of inventory is hitting the market. Could this be a tipping point that sends the D.C. housing scene into a tailspin? Is there already a crash underway?
Before you jump to conclusions, let me share a word of wisdom: be cautious with those doomsday posts floating around on X. It seems everyone has something to say, especially when it’s sensational!
Let’s dig deeper into reliable data sources and find out what’s happening in the D.C. market. Altos Research has the fresh weekly data to provide the answers we need.
Weekly housing inventory data
Let’s first examine the national inventory data. This has always been a key indicator for housing as we move toward normalcy. Although inventory levels are not yet back to average, it’s encouraging to note that we are significantly above the all-time low inventory level of 240,497, recorded in March 2022. We experienced a slight increase in inventory last week and we can anticipate the typical spring surge soon.
- Weekly inventory change (Feb. 7-Feb. 14): Inventory rose from 632,367 to 637,991
- The same week last year (Feb. 9-Feb. 16): Inventory fell from 494,819 to 493,987
- The all-time inventory bottom was in 2022 at 240,497
- The inventory peak for 2024 was 739,434
- For some context, active listings for the same week in 2015 were 954,581
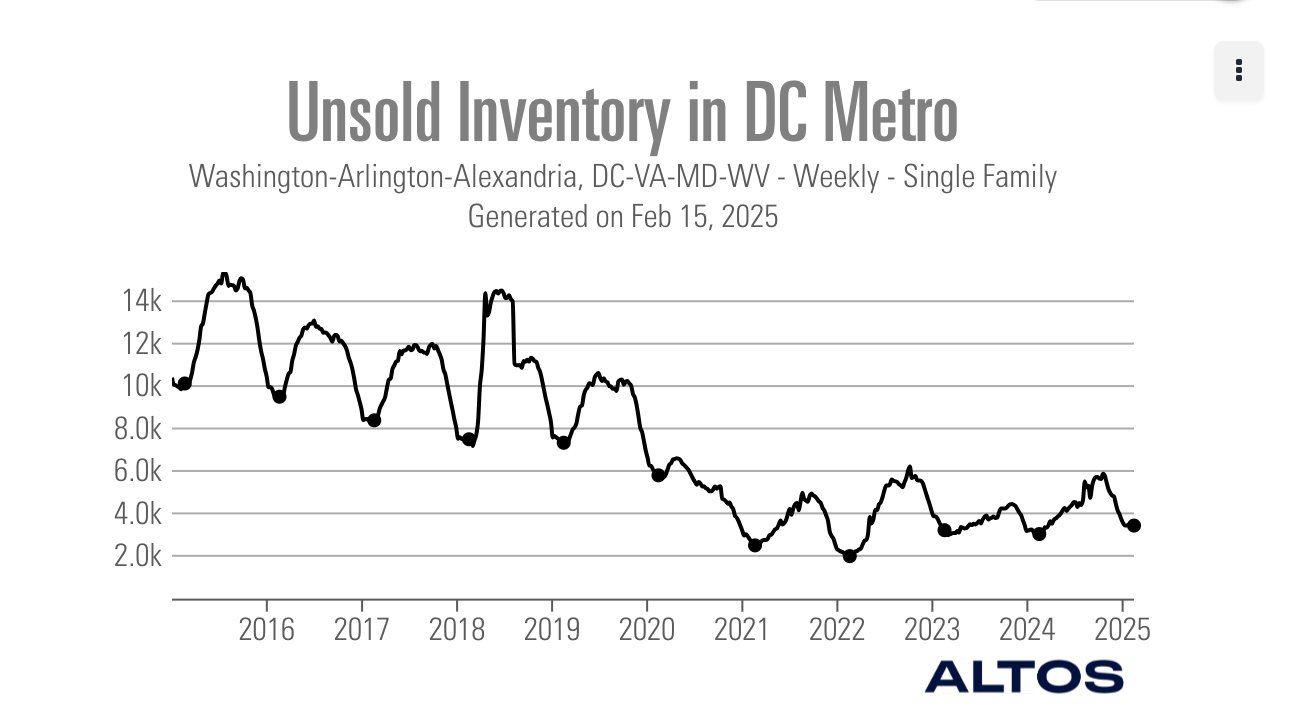
Now let’s look at the DC Metro housing market and see if we can see any signs of the massive inventory surge that’s trending on social media. So far, it looks like we’re not seeing it materialize.
The inventory in the DC metro housing market isn’t much higher than the COVID-19 inventory lows. Remember to be careful when listening to people who have never tracked housing economics. When working from such a low base, inventory exploding higher will be easy to see, much like what we saw in the 2018 data, so if and when it happens, we’ll know.
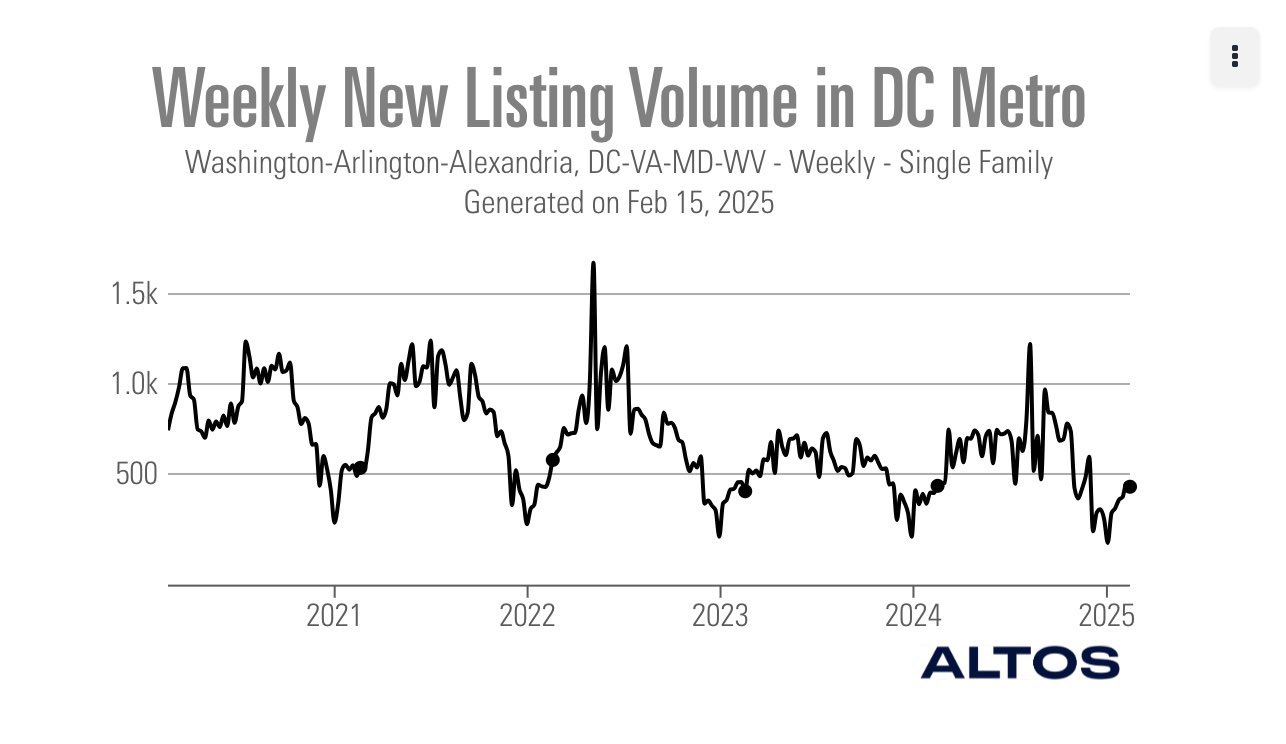
New listings data
The new listing data from Altos Research reflects homes that come to the market without an immediate contract, providing us with a real-time view of any selling pressure in the market. The last two years were the two lowest new listings data years in history.
Last year, I forecasted we would get at least 80,000 per week during the seasonal peak months, but It didn’t happen. This year, I believe we should hit that target. Note that during the housing bubble crash years, this data line ran between 250,000-400,000 per week.
The national new listing data for last week over the previous several years:
- 2025: 56,559
- 2024: 49,556
- 2023: 42,073
Let’s examine the current state of the D.C. market and recent listing data. It appears pretty normal when compared to the last few years. Unfortunately, it seems that those promoting significant inventory surges lacked the appropriate data tools to track these trends effectively.
Jobless claims have been rising in this area over the past few weeks and we can expect a further increase due to the Trump administration’s goal of slashing federal jobs, which some have estimated at 200,000. I like to keep things straightforward: monitor jobless claims, new listing data and active inventory over the next few months and follow the data. However, nothing particularly significant has occurred yet.
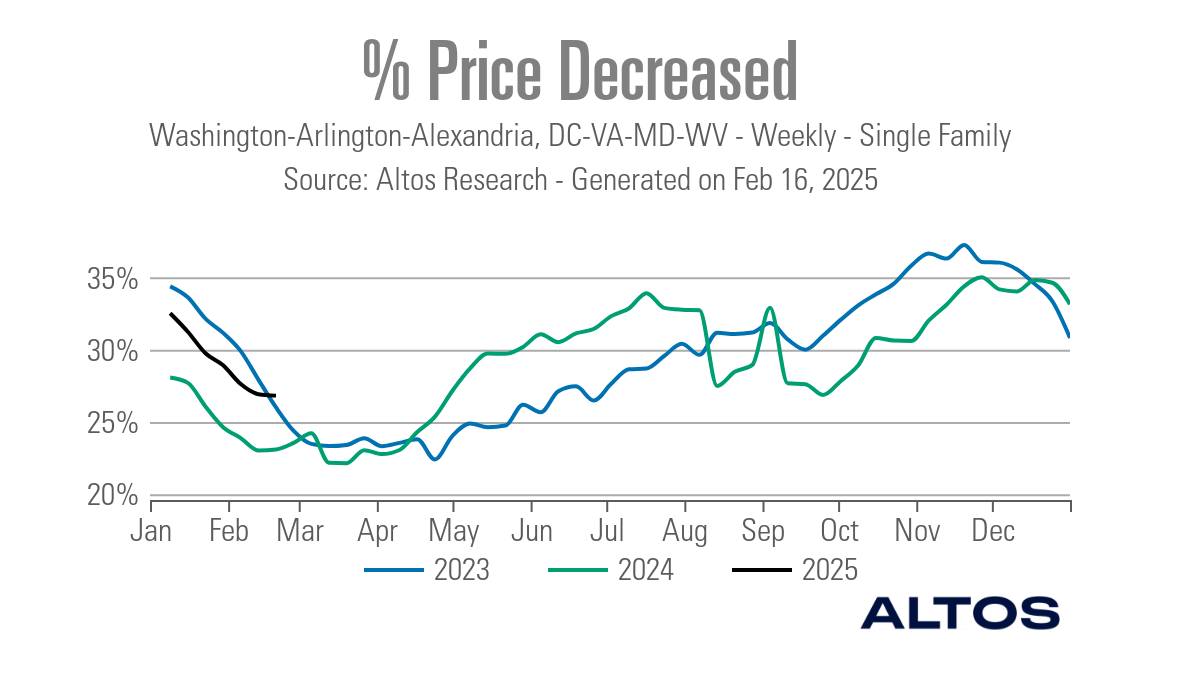
Price-cut percentage
In an average year, about one-third of all homes typically experience a price cut, which reflects the usual dynamics of the housing market. Last year, I had a low forecast, predicting only 2.33% nominal home-price growth, which ended up being too low.
For 2025, I am forecasting growth of 1.77%, indicating another year of negative real home price growth. As inventory increases and if mortgage rates remain above 7%, price growth is expected to cool down. I was mistaken last year, partly because mortgage rates fell to 6% quickly. However, the slowdown in price growth is a positive development for the housing market, which desperately needs it.
Price-cut percentages for last week over the previous several years:
- 2025: 33%
- 2024: 30%
- 2023: 31%
Finally, let’s examine the price cut percentages in the D.C. market. We can observe that the percentage of price cuts is lower than the national average. This doesn’t mean we won’t see stressed sellers as federal workers lose their jobs in the upcoming weeks, but the recent data does not indicate any significant stress in the market yet.
10-year yield and mortgage rates
In my 2025 forecast, I anticipate the following ranges:
- Mortgage rates will be between 5.75% and 7.25%.
- The 10-year yield will fluctuate between 3.80% and 4.70%.
The 10-year yield was wild last week. The CPI report sent bond yields rising, and the next day, the PPI inflation report sent the 10-year yield falling. Friday’s weak retail sales report sent the 10-year yield falling again, pushing mortgage rates under 7%.
Mortgage spreads
The positive story regarding mortgage rates is the improvement in mortgage spreads observed in 2024 and 2025. Without this improvement, mortgage rates would be close to 8% in 2025.
Historically, these spreads typically range between 1.60% and 1.80%. If we were experiencing the worst mortgage spreads of 2023, mortgage rates would be 0.77% higher today. Conversely, current mortgage rates would be approximately 0.73% to 0.83% lower with regular mortgage spreads.
Purchase application data
Purchase application data has been roughly flat this year:
- 2 positive readings
- 1 flat reading
- 2 negative reading
Last week, the weekly data was down 2% weekly but up 2% year over year. Historically, when mortgage rates are high, purchase application data tends to reflect negative trends. For instance, last year, when mortgage rates ranged between 6.75% and 7.50%, the purchase application data showed 14 negative, two positive, and two flat readings.
We will monitor the data closely in February and discuss this and other housing economic topics at our big Housing Economic Summit on Feb. 26 in Dallas.
Weekly pending sales
The latest weekly pending contract data from Altos Research offers valuable insights into current trends in housing demand. This dataset has shown a notable improvement since the summer of 2024, and toward the end of the year, it showed year-over-year growth.
However, as mortgage rates started to rise late into 2024 and stay elevated in 2025, it has facilitated a slight decline in pending sales year over year from where we had been growing. We are still showing higher growth versus 2023 levels, but not by much. Our housing data gets better when mortgage rates are near 6%.
Weekly pending contracts for the past week over the past several years:
- 2025: 303,957
- 2024: 314,053
- 2023: 298,432
The week ahead: Housing data and Fed speeches
This week, we have several key housing data releases, including home builder confidence, housing starts, and existing home sales. On Monday, a few Federal Reserve Presidents will be speaking, and we should pay attention to how the markets react to their comments. On Tuesday, I will be on CNBC to discuss builders and tariffs. Additionally, every Thursday, we can expect jobless claims data to be released, and this information may become particularly interesting soon due to the recent layoffs.
Hopefully, this article provides a better understanding of the housing inventory in the DC marketplace.